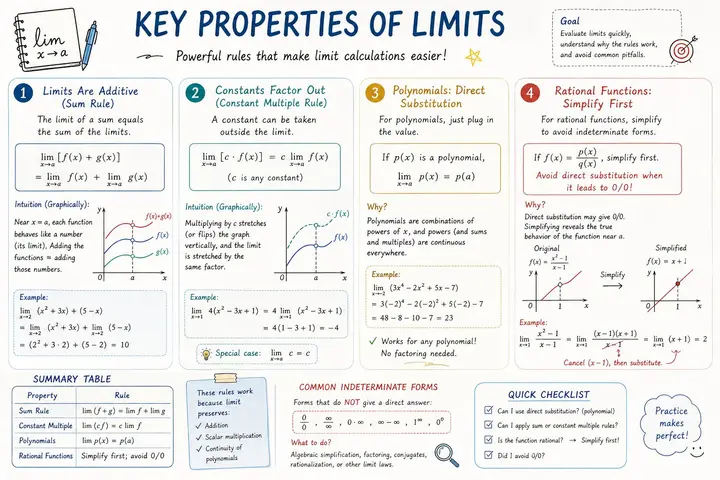
Calculus Study Sheet Infographic Prompt
Please create a mathematical visualization infographic about "[math concept / topic]." The goal is to help the viewer intuitively understand what it is, why it works, its geometric or structural intuition, and how it behaves in different contexts. The visual should feel like a high-quality math lecture handout combined with a hand-drawn educational poster. It should be elegant, clear, and information-rich, but not cluttered. Visual style: either portrait or landscape is fine. Use a clean, light paper-like background, with a deep blue title and black or dark gray lines for the main content. Add a small number of refined accent colors such as blue, teal, gold, and red. Incorporate rounded-corner cards, thin borders, numbered labels, hand-drawn arrows, zoom-in callout boxes, and a summary section. The overall design should be aesthetically pleasing, balanced, and academic, allowing the viewer to grasp the structure of the concept and why it works at a glance.
- Prompt and image by
- @hqmank
- Source:
- Original post
- License:
- MIT. Image resized for the web.
Are you the creator and want this removed? Email support@kromoss.net.
More Infographics ideas
See all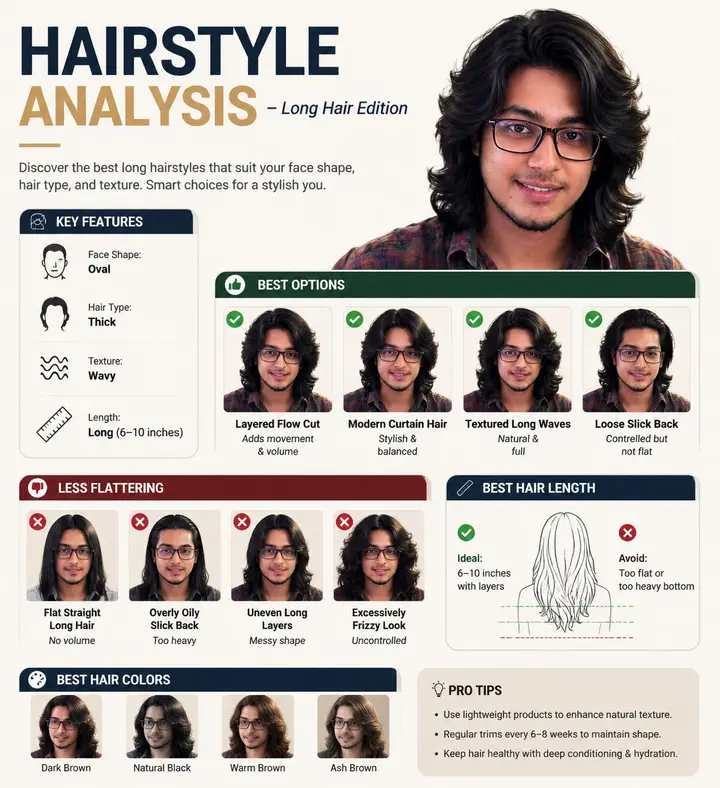
Create a professional "HAIRSTYLE ANALYSIS" infographic with a different male model (the same face) having long, thick hair (6-10 inches), slightly wavy texture. Style should be clean, modern, premium grooming guide (similar layout but not identical). TOP TITLE: "HAIRSTYLE ANALYSI…
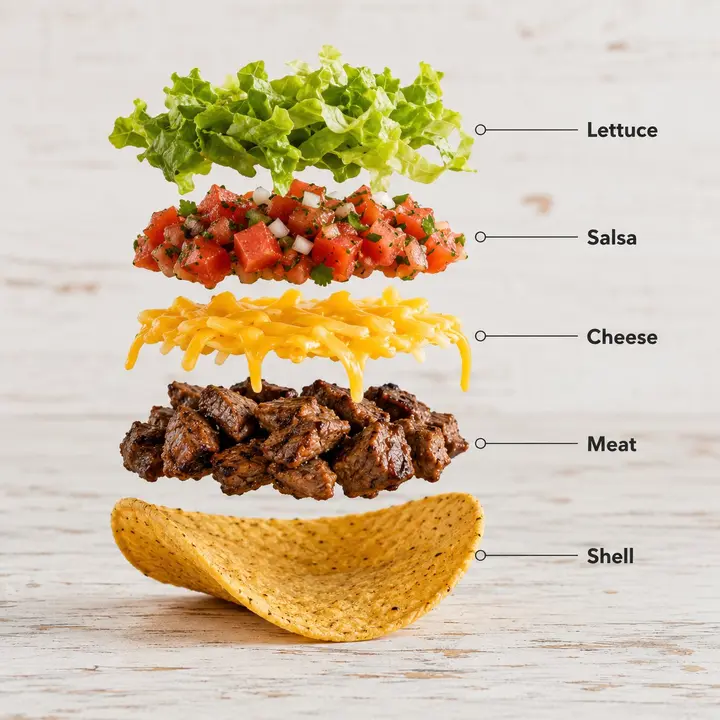
Create a hyper-realistic exploded vertical infographic composition of tacos. Top → Bottom structure: Fresh Lettuce (crisp green texture with natural folds) → Tomato & Salsa Layer (juicy diced tomatoes and salsa mix) → Melted Cheese (smooth cheddar texture) → Grilled Meat Filling…
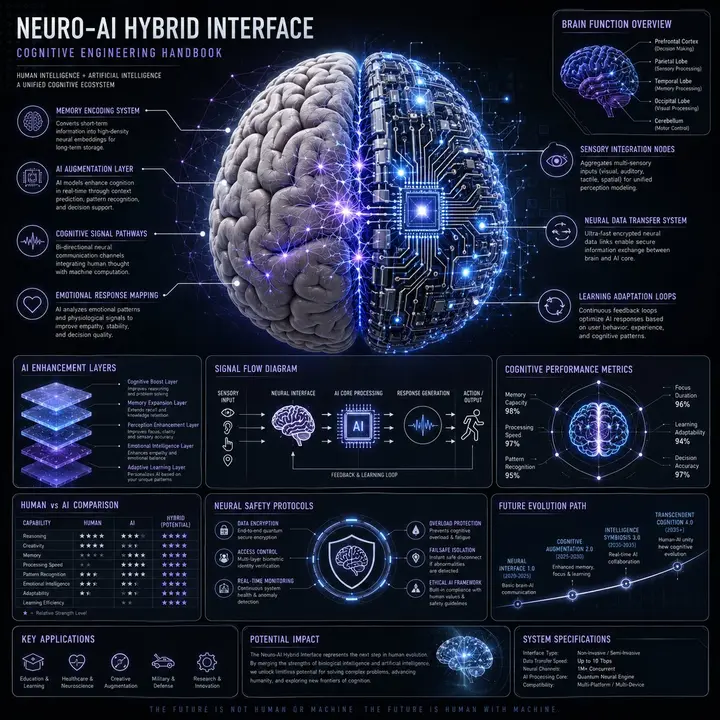
Create a premium square “neuro-AI hybrid system infographic” designed as a scientific cognitive engineering handbook page. Visual Direction: • 1:1 composition • dark neutral background with glowing neural network overlays • palette: electric blue, violet, soft white, silver • ele…
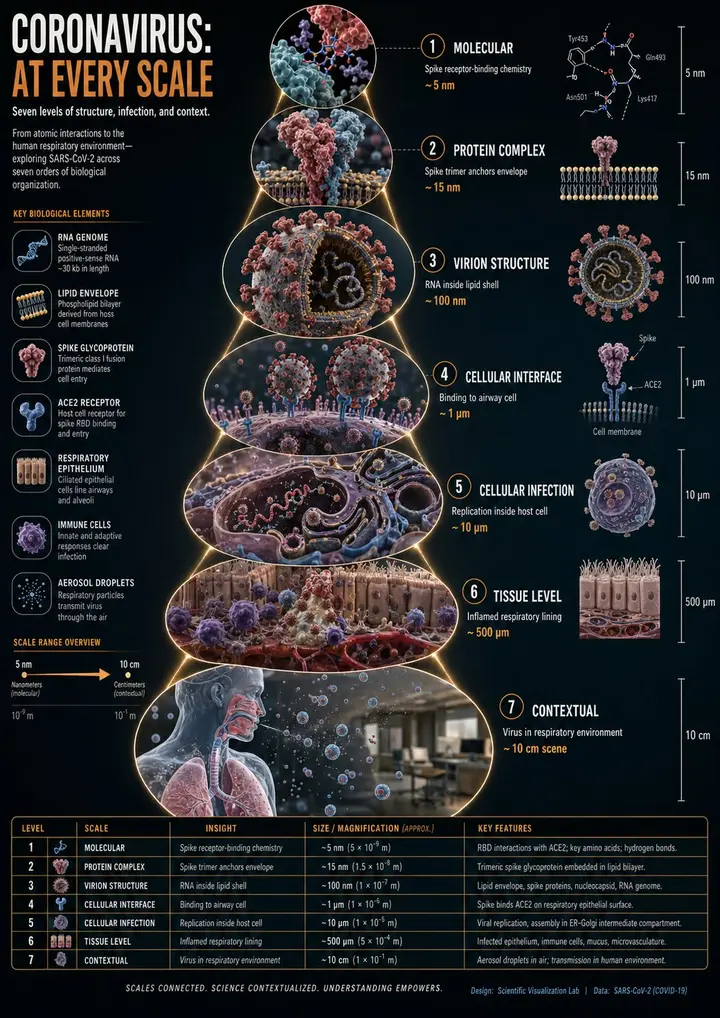
instructions> [SUBJECT]=Coronavirus. A hyper-realistic 3D zoom-sequence infographic generated from a single input: [SUBJECT]. The system auto-detects scale layers from atomic/subcomponent to full contextual view. Layout Structure (CRITICAL) 6–8 circular or hexagonal frames arrang…
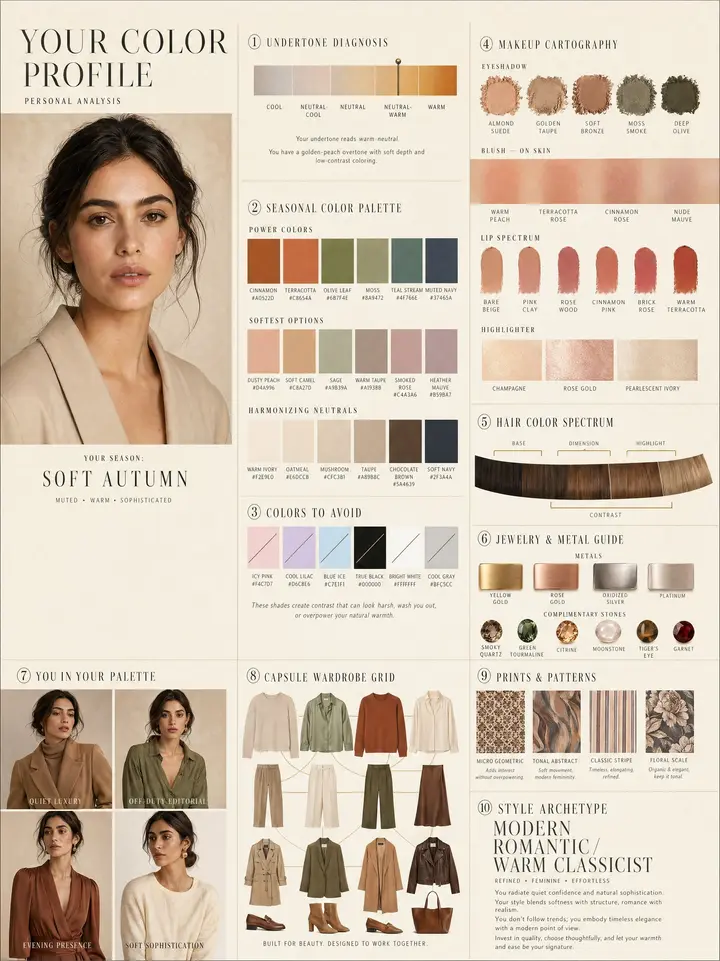
LUXURY PERSONAL COLOR PROFILE — EDITORIAL LAYOUT Studio portrait of subject as anchor — skin retouched to luminous glass-like perfection, preserved natural structure, realistic pore texture, soft directional key lighting, no facial alteration. Background: warm ecru parchment with…
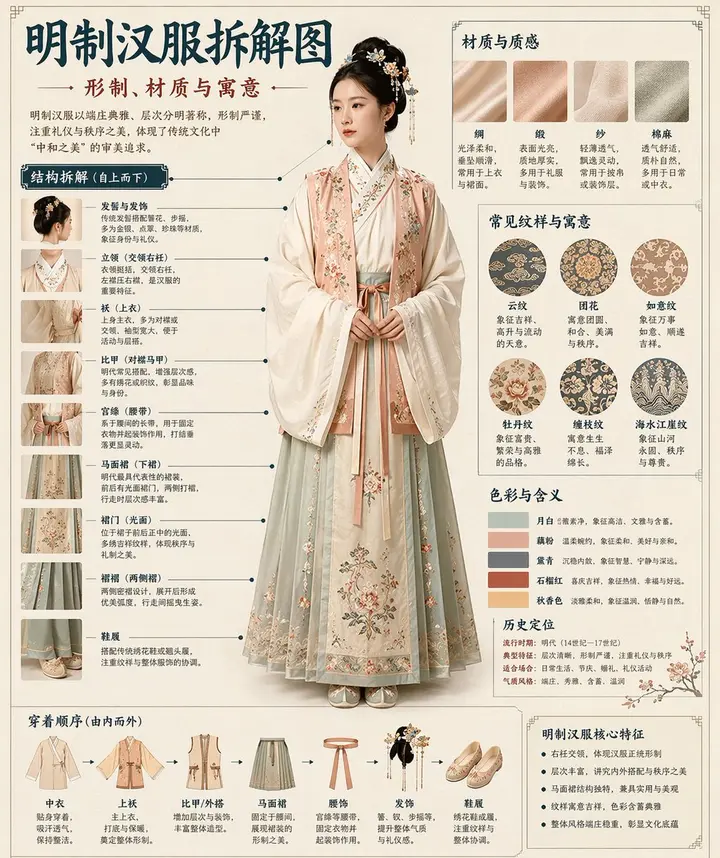
Please automatically generate a "museum catalog-style Chinese disassembly infographic" based on the [Subject]. The entire image is required to combine a realistic main visual, structural disassembly, Chinese annotations, material descriptions, pattern meanings, color meanings, an…
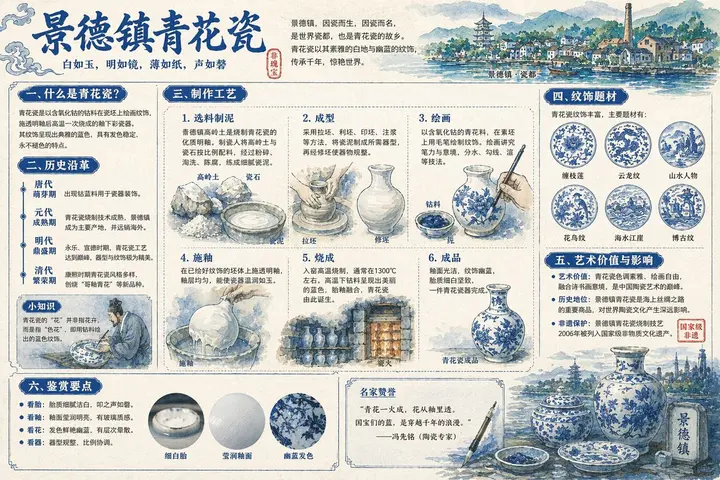
Generate a detailed explanatory diagram of Jingdezhen blue and white porcelain, accompanied by detailed Chinese knowledge analysis.
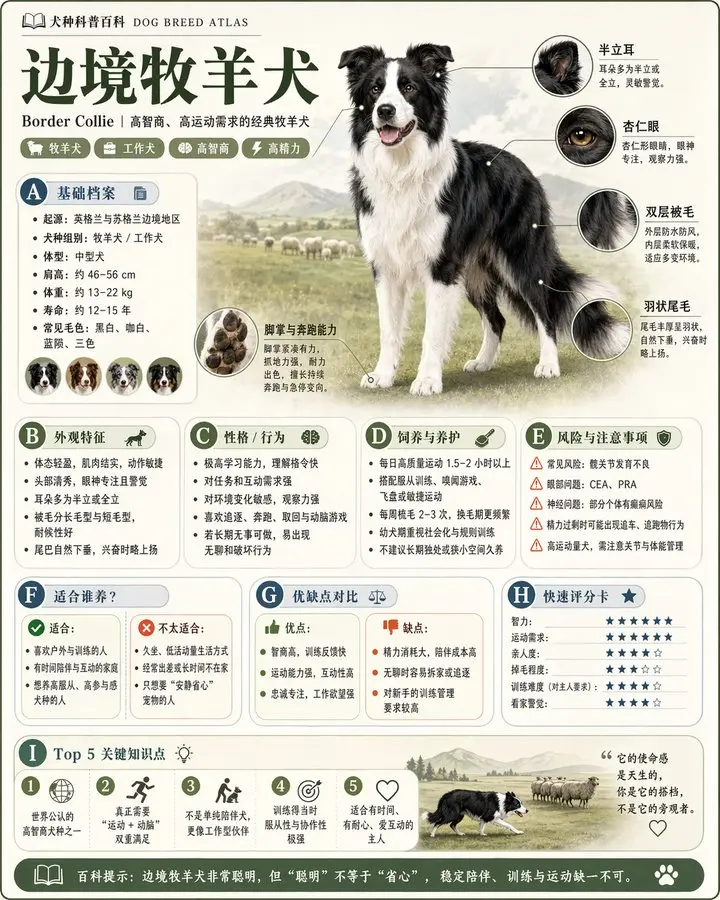
Please generate a high-quality vertical "Popular Science Encyclopedia Infographic" based on the [Topic]. This image is not an ordinary poster, nor a simple illustration, but a modular popular science infographic with a sense of "illustrated guide, encyclopedia, information struct…